

Fleet leaders do not need more dashboards. They need a small, trusted set of metrics connected to decisions, owners, and operational actions.
Why fleet operations teams drown in data without getting better outcomes
Modern fleets are typically connected to multiple data sources. But data overload is not an inevitable consequence. In fact, it is most often caused by the structure of your operation rather than the number or volume of information. A lot of data points can be useful, but it’s how they are managed that can leave operators and fleet managers feeling overwhelmed.
This is often down to a variety of factors, including:
- Fragmented systems: Telematics, maintenance, reservations, charging, dispatch, and finance platforms hold separate versions of fleet performance.
- Inconsistent definitions: Teams may calculate certain metrics differently depending on the system they use.
- Dashboard proliferation: Each system reports what it can measure rather than what the business needs to make a decision.
- Equal weighting: Critical service risks are presented alongside low-priority information, making it hard to filter out the noise.
- Missing operational context: A vehicle’s status means little without the context of its next booking, charging requirements, location, or maintenance constraints.
- No action layer: Operators are bombarded with data, but there’s no layer to assign ownership or initiate the next workflow.
Information overload is real, and more data doesn’t necessarily mean better outcomes. But the solution is not to limit data, rather it is to create a single source of truth and filter operational data based on the decisions each team needs to make.
This does not require every function to use the same system. Instead, it requires creating a unified layer that integrates various sources under agreed-upon definitions, harmonizes and normalizes data, and provides an authoritative source for each metric. AI-powered fleet analytics software can support this by connecting data, identifying relevant signals, and helping teams respond.
Metrics that move fleet performance in practice
Visibility into the relevant data is what matters. Not every fleet will have the same priorities, so it’s important to understand which metrics matter to you. These can be broken down into three categories: business outcomes, operational drivers, and diagnostic signals.
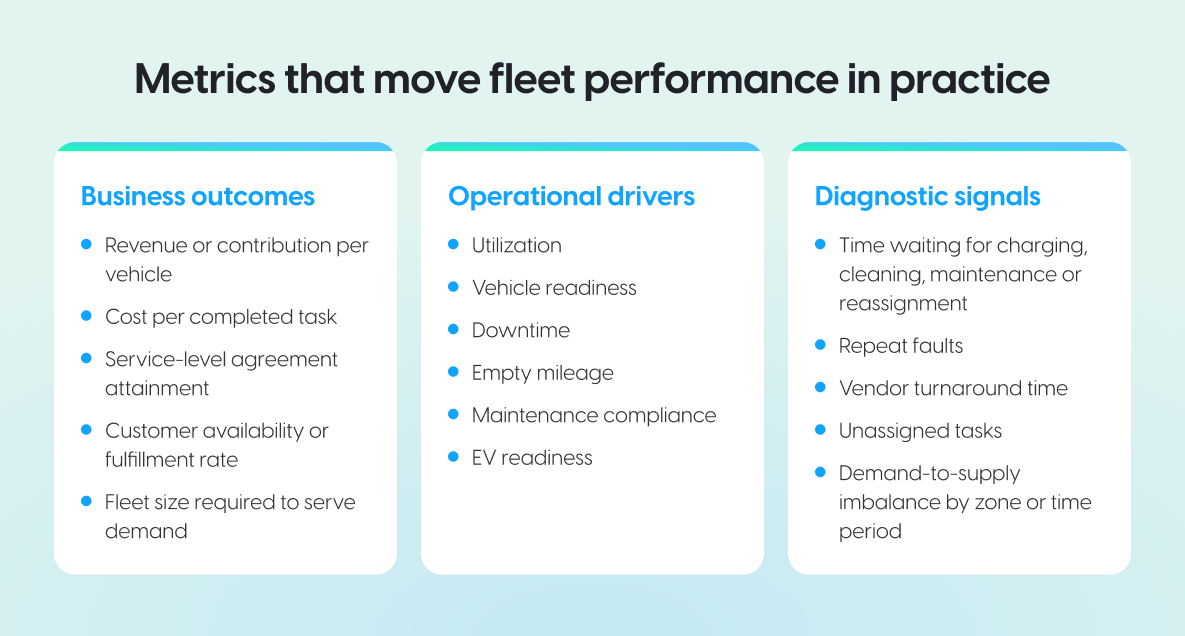
Business outcomes
For leadership teams, it’s important to focus on the metrics that show whether fleet operations support profitable, reliable growth. These include, for example:
- Revenue or contribution per vehicle
- Cost per completed task
- Service-level agreement attainment
- Customer availability or fulfillment rate
These metrics provide better visibility into the fleet and its impact on the business, helping leadership teams make decisions that increase revenue, cut costs, or improve service levels.
Operational drivers
For fleet and operations teams, the relevant metrics directly reflect fleet performance. These include, to name a few:
- Utilization
- Vehicle readiness
- Downtime
- Empty mileage
- Maintenance compliance
Understanding these metrics allows fleet managers and operators to make decisions related to efficiency, fleet size, and other areas for improvement.
Diagnostic signals
These metrics help the organization stay operational, handle accidents, breakage or malfunctions, and understand why an outcome changed. These include:
- Time waiting for charging, cleaning, maintenance, or reassignment
- Telematics vehicle information
- Repeat faults
- Vendor turnaround time
- Unassigned tasks
- Demand-to-supply imbalance by zone or time period
These metrics can help uncover and diagnose issues before they become larger problems. They are most often used by operations teams but can provide useful information for leadership teams looking to make broader decisions about fleet performance.
Zipcar’s work with Autofleet shows how these layers connect. Downtime affects revenue and vehicle availability, while charging data informs the tasks needed to keep EVs ready for use.
How to build a metric framework that filters noise
In order to properly track and benefit from these metrics, you need a repeatable framework that allows you to work on a single outcome at a time. Rather than adding another dashboard full of information that no one will use, this process integrates with your current systems and lets you create a framework directly linked to business objectives and the decisions required to achieve them.
1. Start with the outcome
Choose one commercial or operational result. This might be higher utilization, lower downtime, or better booking fulfillment.
2. Identify the decisions that control the outcome
Work backward from that outcome. Identify the operational decisions that have a direct influence on it.
3. Select the smallest set of signals needed
Keep signals that change a decision, expose a material risk, or confirm the outcome. Leave everything else available for investigation without placing it on the main dashboard.
4. Create the KPIs
Define each KPI’s formula, source, owner, reporting period, and intervention threshold. Every team should calculate it consistently.
5. Separate monitoring, KPIs, and alerts
Use monitoring for current conditions, KPIs for progress, and alerts for situations requiring action. This gives fleet performance monitoring a clear hierarchy.
6. Close the loop with workflows
Use fleet automation to convert a signal into a task, assignment, or escalation, then measure the result. For example, Element Last Mile Rental combined real-time vehicle data with automated workflows for maintenance, repairs, and ordering.
Example
A rental fleet wants to improve booking fulfillment. A van reserved for 9 a.m. is awaiting cleaning, with completion expected at 9:30. The decision is whether to prioritize cleaning or assign another suitable van. The relevant signals are the pickup deadline, expected readiness time, and available replacements. A workflow flags the booking at risk and escalates the cleaning task or prompts reassignment. The team tracks the percentage of confirmed bookings with a suitable vehicle ready at the agreed pickup time to measure whether these interventions improve fulfillment.

Common mistakes fleet operators make when choosing what to measure
A focused framework can still fail if the wrong measures are selected. For instance, reporting completed maintenance jobs creates an activity, but does not show whether vehicles returned to service faster. Here are some common mistakes:
- Measuring what is easy to collect: Data availability should not determine operational importance.
- Tracking averages alone: An acceptable fleet-wide average can conceal serious problems by location, vehicle type, shift or customer.
- Using poorly defined ratios: Utilization is misleading if teams disagree about what counts as available or productive time.
- Treating every metric as equally important: Dashboards need hierarchy and prioritization.
- Creating alerts without actions: Every alert should have an owner, urgency level, and response.
- Rewarding activity instead of outcomes: The number of completed maintenance tasks matters less than whether those tasks reduce downtime.
- Automating unreliable metrics: Automation increases the impact of incorrect definitions, stale data, and false positives.
- Keeping obsolete KPIs: If a metric no longer informs a decision, remove or archive it.
From fleet data to confident operational decisions
More data only helps when fleet teams can use it with confidence. A focused metrics framework gives leaders a clear view of results and helps operations teams turn emerging risks into timely action. This reduces decision delays and keeps attention on the outcomes the fleet is there to deliver.


Table of сontents