

Most fleet managers face the same reality: mountains of data and reports that are impossible to make sense of, vehicles sitting idle while costs pile up, drivers that are hard to track, waiting for assignments… You know the solutions are all there, but you are having trouble figuring them out, and it's hard to get started.
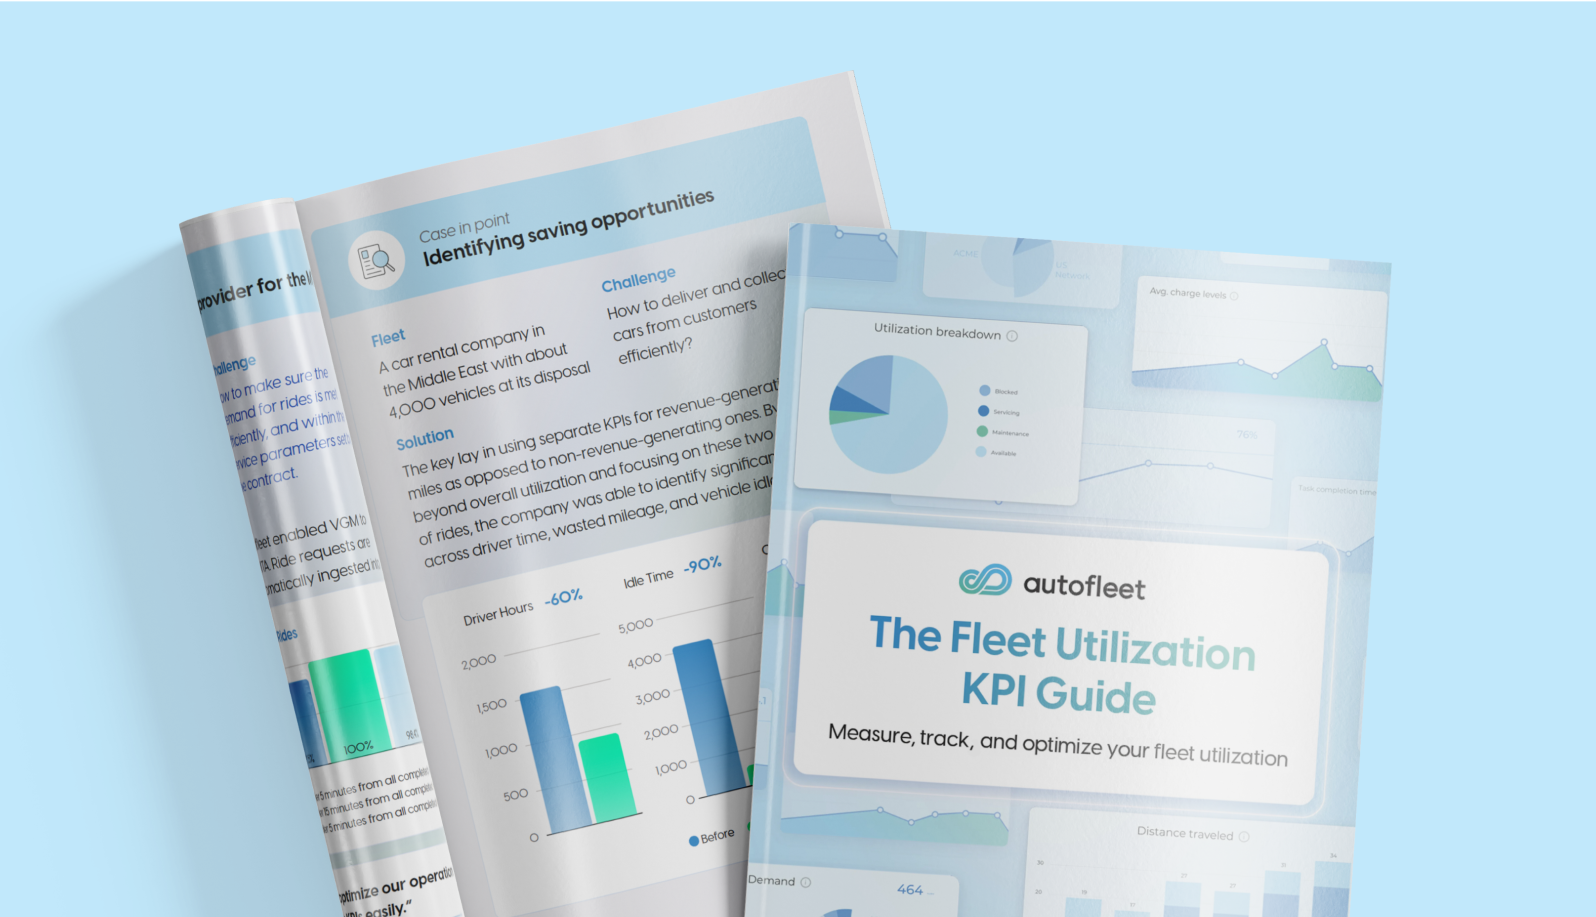
Sound familiar? You're not alone. This is what the “Fleet Utilization KPIs Guide” is all about. Providing fleet managers with practical tools to understand and act upon utilization KPIs, with real-world examples and case studies that are easy to understand.
Pain points are easier to fix once you name the numbers behind them. A short set of fleet utilization metrics can turn vague frustration into something you can measure week over week and act on.
What keeps fleet managers up at night?
Vehicle Availability: When your fleet sits unused, you're still paying for insurance, depreciation, and parking. Meanwhile, when you actually need vehicles, they're either in maintenance, being cleaned, or stuck in traffic, generating zero revenue.
Downtime Disasters: Unplanned repairs hit at the worst possible moments—during peak delivery hours or right before a major client pickup, and it is so much more expensive than regular maintenance. Each vehicle down means lost revenue, frustrated customers, and scrambling to find alternatives.
EV Charging Complexity: Electric vehicles have lower operating costs, but now you're dealing with range anxiety, charging infrastructure limitations, and vehicles that spend more time plugged in than on the road.
Data Overload: You're drowning in reports and dashboards, but still can't answer basic questions like "Which vehicles are making money?" or "Why did our fuel costs spike last month?"
What do the most successful fleet managers do differently?
The best fleet managers focus on measuring what matters. They've discovered that utilization KPIs—the metrics that show how much time vehicles spend actually working—are the key to transforming these pain points into competitive advantages.
Distinguish between profitable (or working miles) and dead miles
Smart fleet managers track revenue-generating miles separately from deadhead miles. This simple shift in perspective helps them:
- Remove wasteful administrative vehicle movement
- Eliminate unnecessary empty runs
- Optimize routing to maximize paid mileage
- Identify which vehicles consistently underperform
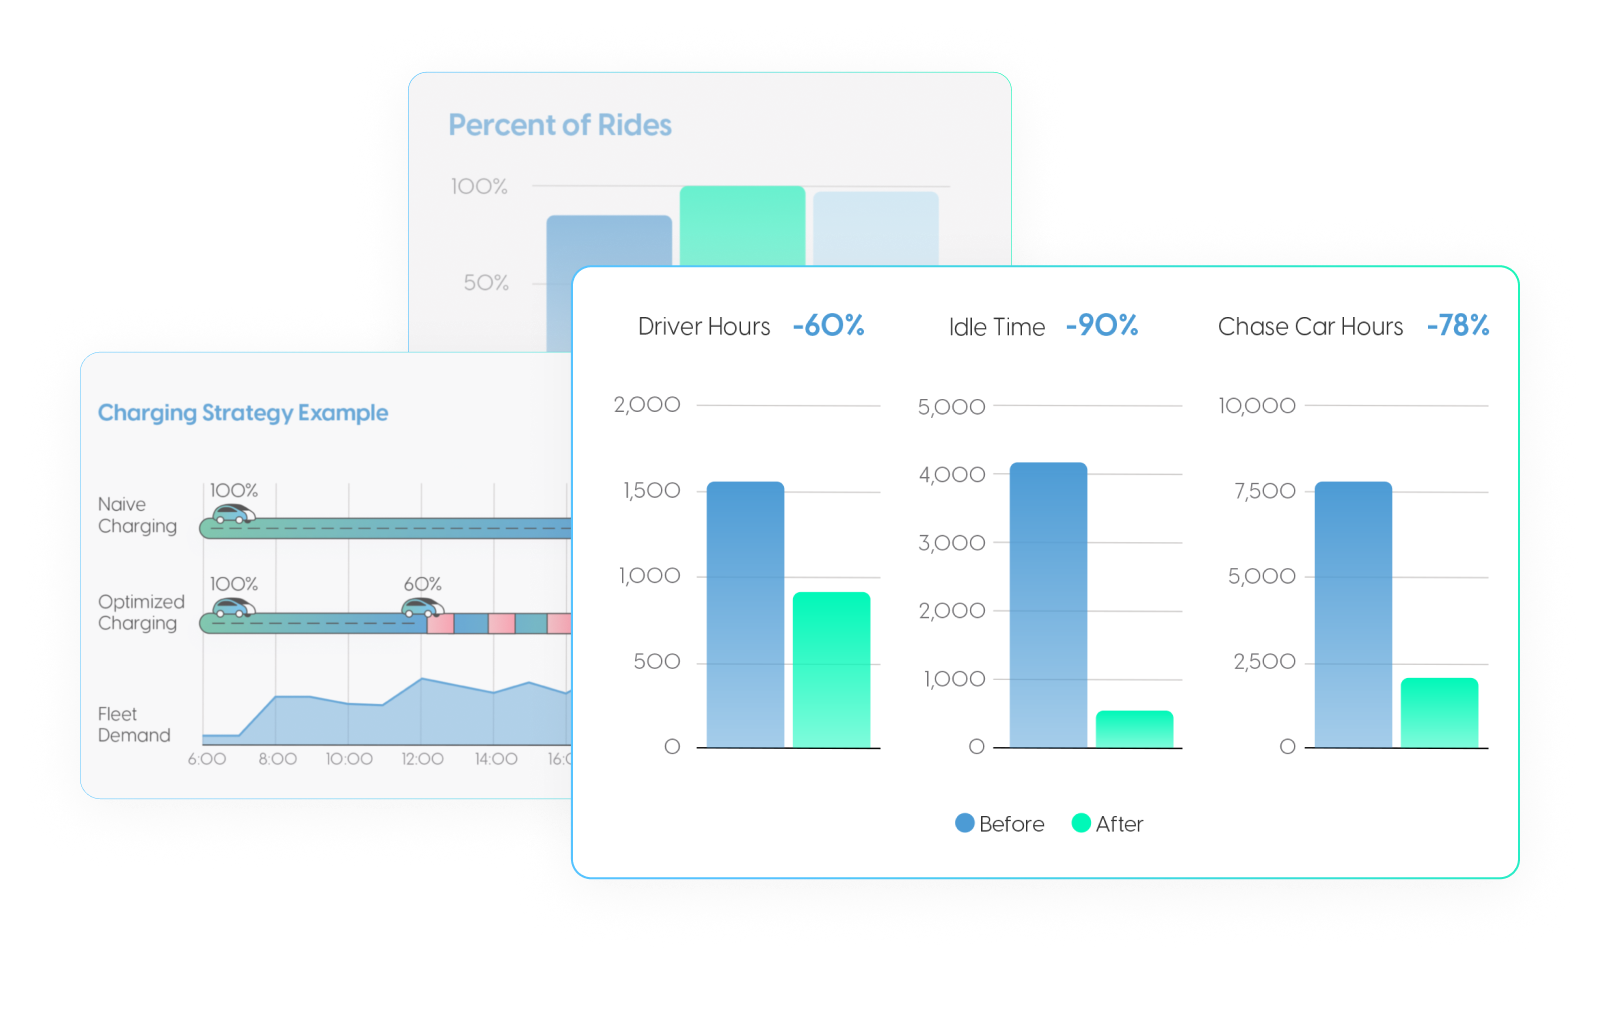
Real Result: One car-sharing fleet increased vehicle usage by 25% simply by tracking utilization KPIs that revealed hidden inefficiencies.
Never miss an opportunity to turn downtime into a strategic opportunity
Instead of relying on rigid schedules, or worse, waiting for breakage or a customer complaint before performing necessary upkeep tasks such as maintenance and cleaning, top performers make sure to intelligently schedule these activities.
- Identify natural low-demand periods, and aim to schedule tasks during these times.
- Use telematic triggers and usage statistics to launch automatic workflows
- Bundle multiple tasks into a single downtime window
- Use predictive maintenance to avoid emergency repairs
- Coordinate with drivers and vendors to minimize disruption
Real Result: A major fleet reduced cleaning downtime by over 70% through strategic scheduling based on utilization metrics.
Master EV operations
Electric vehicle management, while presenting unique challenges, becomes significantly more manageable and efficient when fleet operators track and analyze the right KPIs related to charging infrastructure and battery health. Focusing on specific charging KPIs to optimize operations can inform crucial insights into charging patterns, infrastructure utilization, and overall energy consumption, enabling data-driven decisions that translate into tangible benefits for the fleet:
- Optimize charging schedules around actual workload patterns
- Monitor battery levels in real-time to prevent range issues
- Coordinate charging with route planning for maximum efficiency
Real Result: One case study found in the guide tells the story of a delivery fleet that achieved a 28% increase in daily task completion per EV by combining smart charging strategies with route optimization.
Smart automations let you set it and forget it
The most successful fleet managers aren't manually tracking every metric—they're using automated workflows triggered by KPI thresholds. This means:
- Maintenance gets scheduled automatically based on usage patterns
- Cleaning and other tasks trigger based on booking counts or time intervals
- Anomalies get flagged before they become expensive problems
- Performance issues surface immediately, not in monthly reports
This not only saves a lot of time and effort spent on manual tasks, it also prevents errors and ensures workflows are streamlined and efficient, saving on both operational and overhead costs.
True professional also use automations to prioritize tasks. A regular maintenance task for example will get a lower priority 1000 miles before it is due, but as the threshold for it gets closer will be given a higher priority.
The fleet utilization metrics worth tracking first
Vehicle utilization rate is an anchor. It measures how much of a vehicle's available time is spent in productive, revenue-generating service, calculated as active operating hours divided by total available hours. The right target depends on your operation, shift patterns, and how much buffer you need for demand spikes, but the direction is always the same: get more productive time out of every asset you already pay for. This number matters because a vehicle can be available almost all the time and still sit unproductive if nothing meaningful is assigned to it.
From there, a handful of fleet performance KPIs round out the picture: cost per mile, downtime percentage, average time between reservations, and dead-mile ratio. Each one exposes a different source of waste, and the waste is larger than most operators assume. Recently DPD UK won The Optimizers Awards for cutting out more than 900 vans without compromising its performance, a move that not only saved money on the vehicles themselves but also significantly cut maintenance downtime.
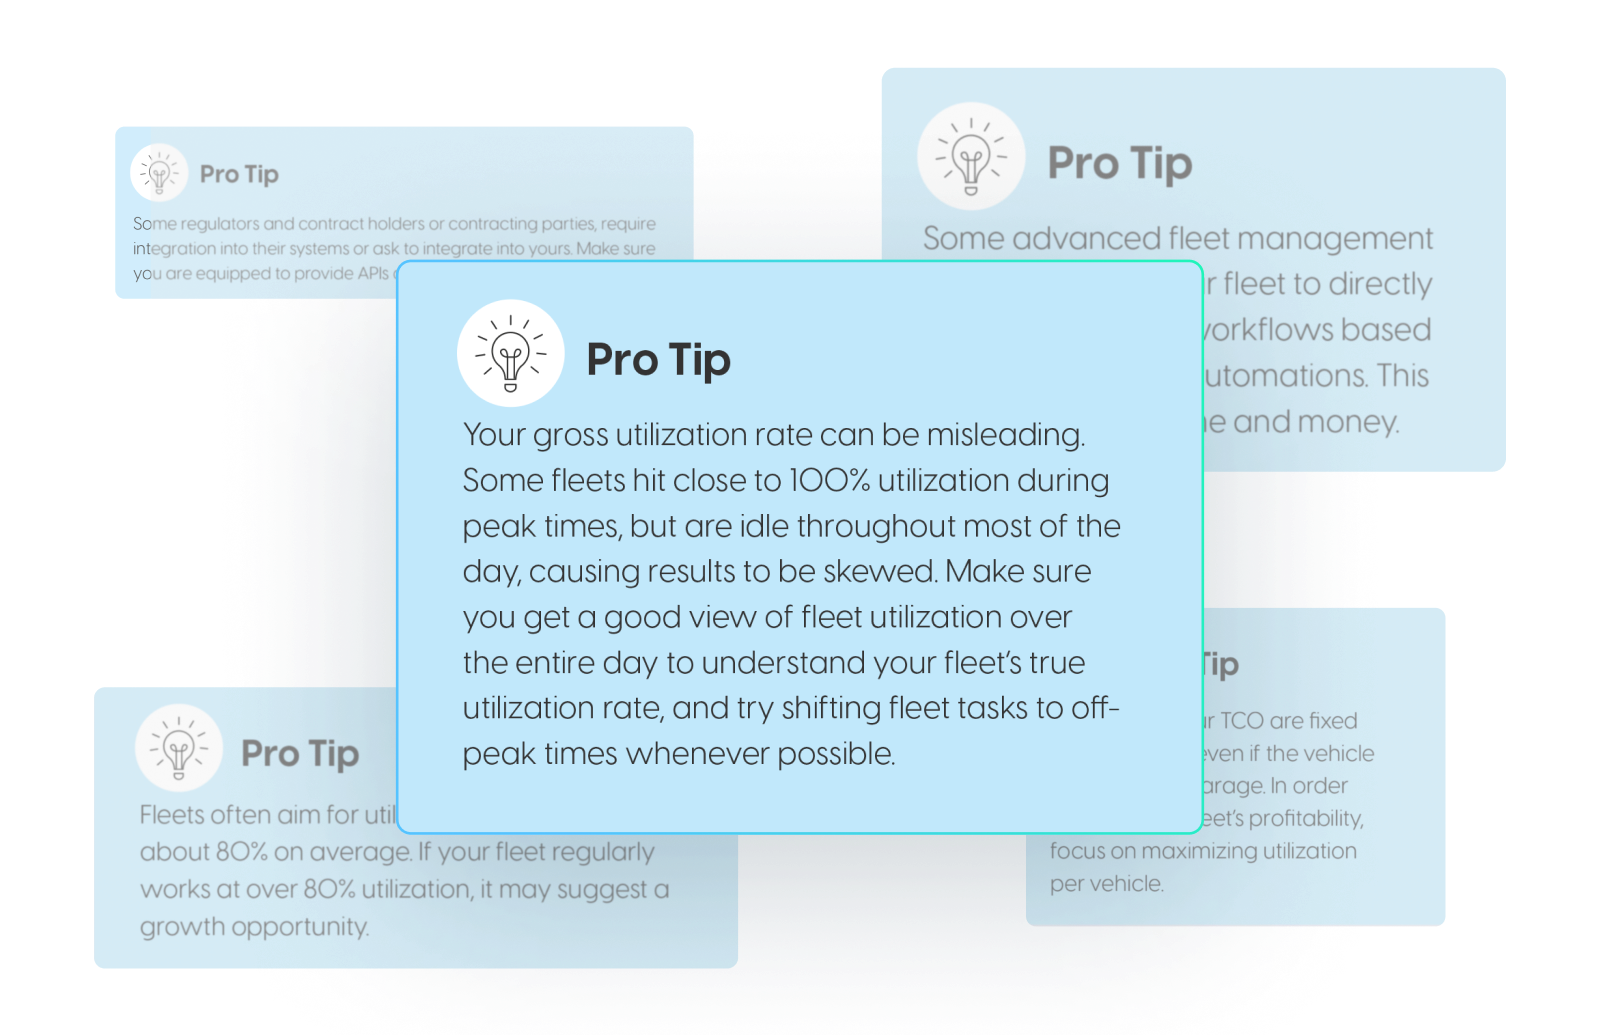
Track these KPIs together to avoid letting a single healthy-looking average hide a assets that are quietly draining budget. A fleet averaging 65% utilization can still hold vehicles reserved every day, sitting next to others parked for weeks.
Consistent fleet efficiency tracking is what turns these metrics into decisions. Snapshots taken once a quarter only tell you what has already gone wrong. A steady cadence tells you what is changing while you can still influence it, which is why leading operators review core numbers weekly and run deeper benchmark comparisons every quarter.
The goal is not a perfect score. A fleet pinned at 100% utilization is turning away demand and skipping maintenance, and one hovering near 40% is paying fixed costs on assets that rarely move. Balanced, well-measured fleet utilization metrics keep you in the productive middle where the fleet earns without breaking down.
Start managing with the right data
Operating without fully leveraging utilization KPIs leaves you flying blind, forcing you to react to problems instead of preventing them.
Using these metrics to fully understand your fleet's operations will help you tackle rising fuel costs, driver shortages, and customer demands with clear insight into what matters most—and the ability to act on it.
Ready to transform your fleet operations? Learn exactly which utilization metrics will solve your specific challenges and discover the automated workflows that are helping fleet managers sleep better at night using the “Fleet Utilization KPI Guide .


Table of сontents